from sklearn.ensemble import RandomForestRegressor

# Train RF on 25 years of country-level emissions data
rf = RandomForestRegressor(n_estimators=500, max_depth=12)
rf.fit(X_train, y_train)

# Extract and rank feature importances
importances = pd.Series(
    rf.feature_importances_, index=feature_names
).sort_values(ascending=False)

# Top predictor: energy_mix_fossil (0.31)
# R² = 0.89 on held-out test set
Predicting Global CO2 Emissions
Which countries are on track to blow past their emissions targets, and why? I trained Random Forest and XGBoost models on 25 years of country-level data to predict per-capita CO2 trajectories — then used feature importance analysis to identify the socioeconomic and energy-mix variables that actually drive national emissions profiles.
So what: The model revealed that energy mix composition and GDP growth rate explain more emissions variance than population or industrialization level — suggesting that energy policy, not demographic change, is the key lever.
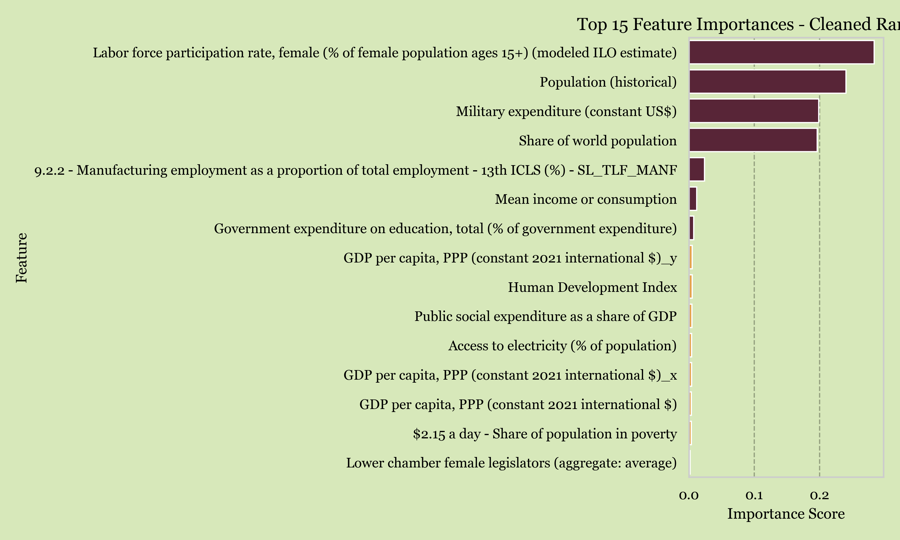
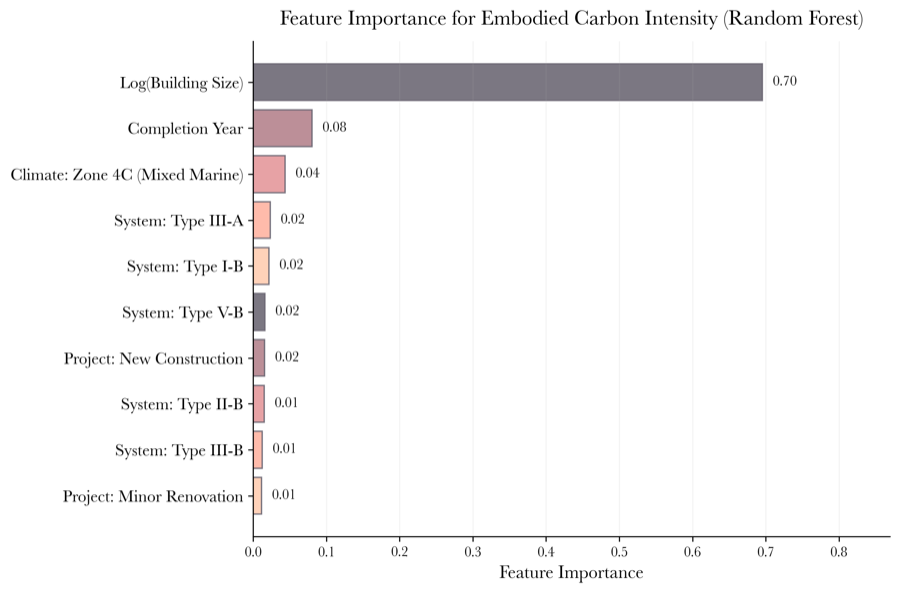
Feature Importance
Energy mix and GDP growth rate dominate — demographic variables like population barely register, challenging conventional assumptions about what drives emissions.
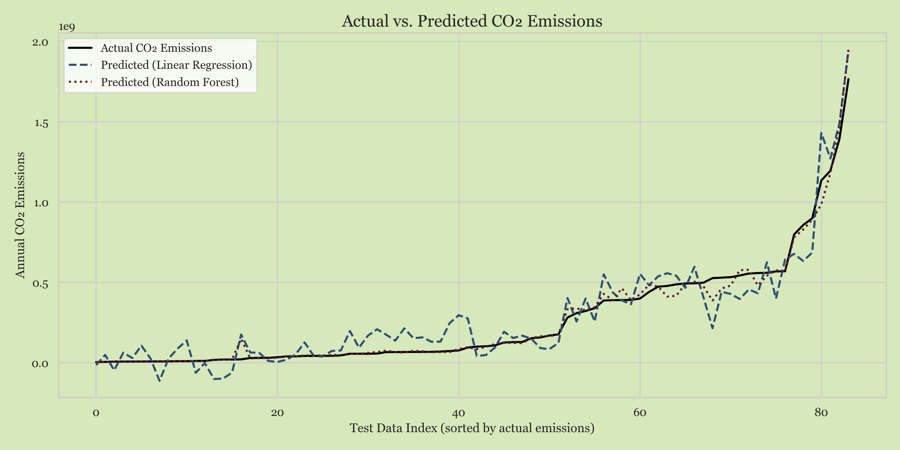
Model Validation
Actual vs. predicted CO2 emissions on held-out test data. Tight clustering along the diagonal confirms strong predictive accuracy across diverse country profiles.

Feature Correlations
Mapping how every candidate predictor co-varies with per-capita emissions — exposing redundant features and isolating the independent signals the Random Forest leans on.
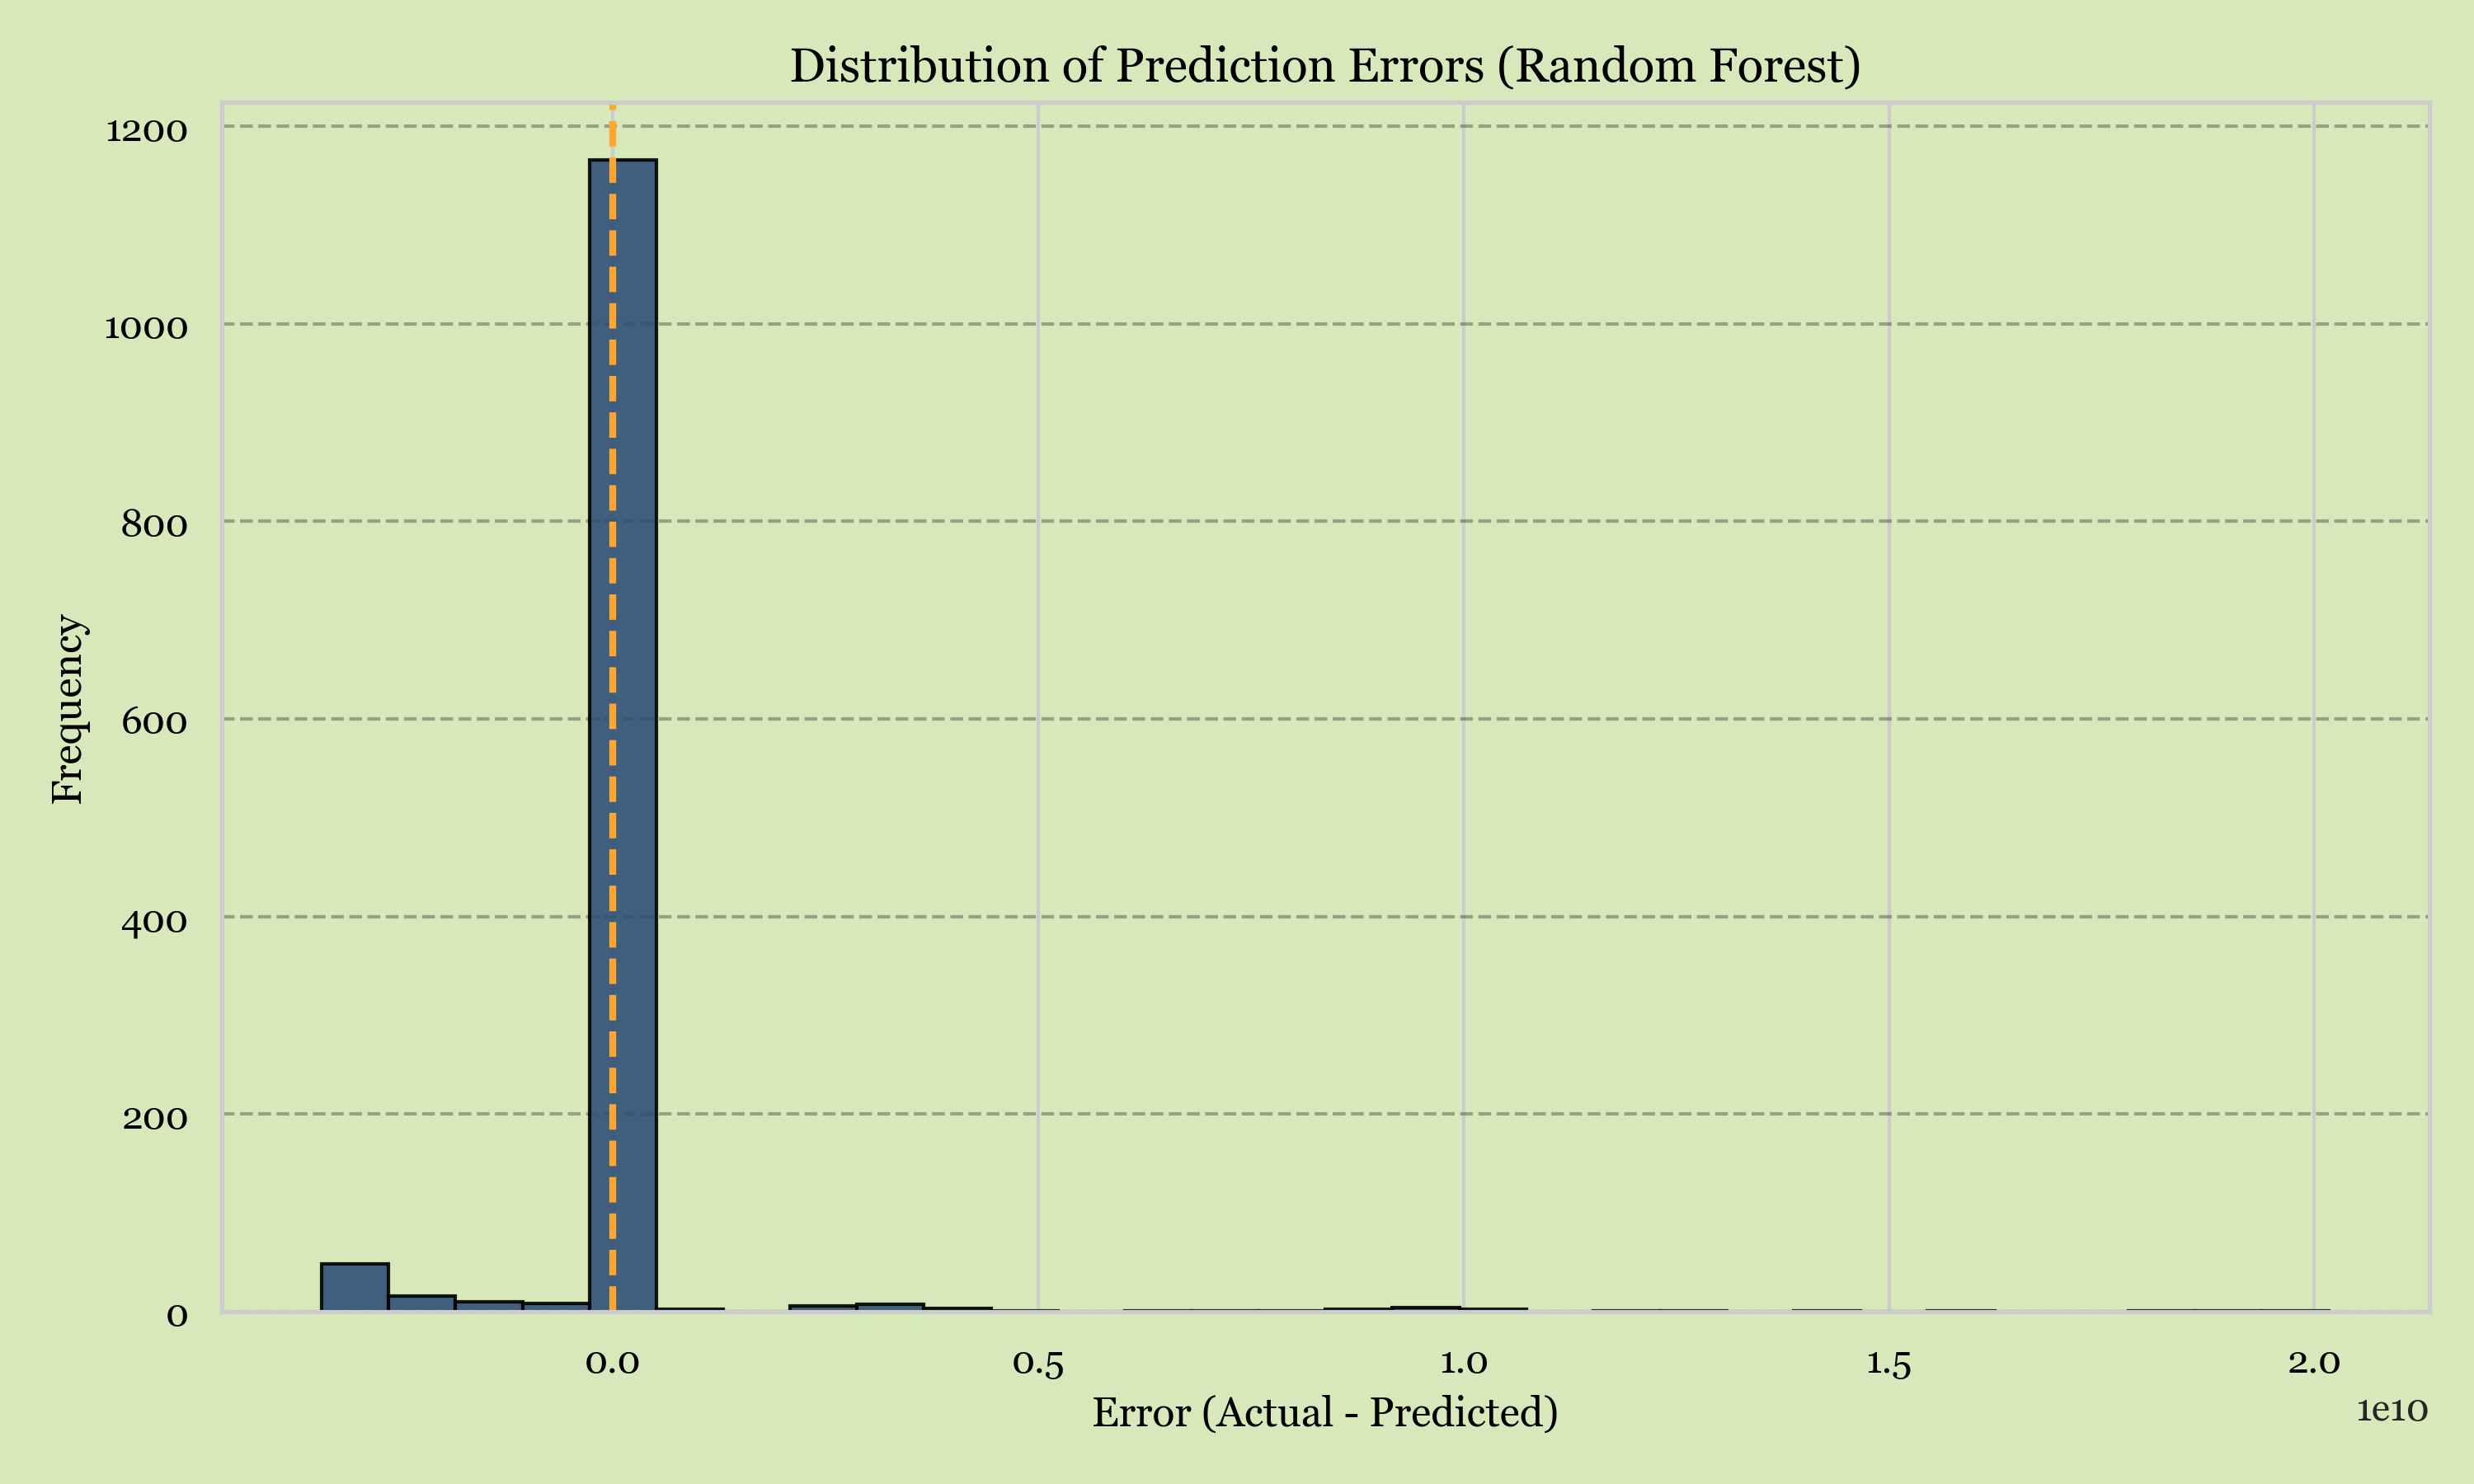
Error Distribution
Residuals cluster tightly around zero with no systematic bias — the model isn't just accurate on average, it's accurate consistently, country to country.